Touch Sensing
The same principles that allow a panel to determine the direction of a sound source may also be applied to determine touch location. Work in this area was primarily supported by a grant from the National Science Foundation. My Ph.D student, Benjamin Thompson is the first author on a paper that details the methods described below. My good friend Dave Anderson also holds an interesting patent on this idea that can be found here.
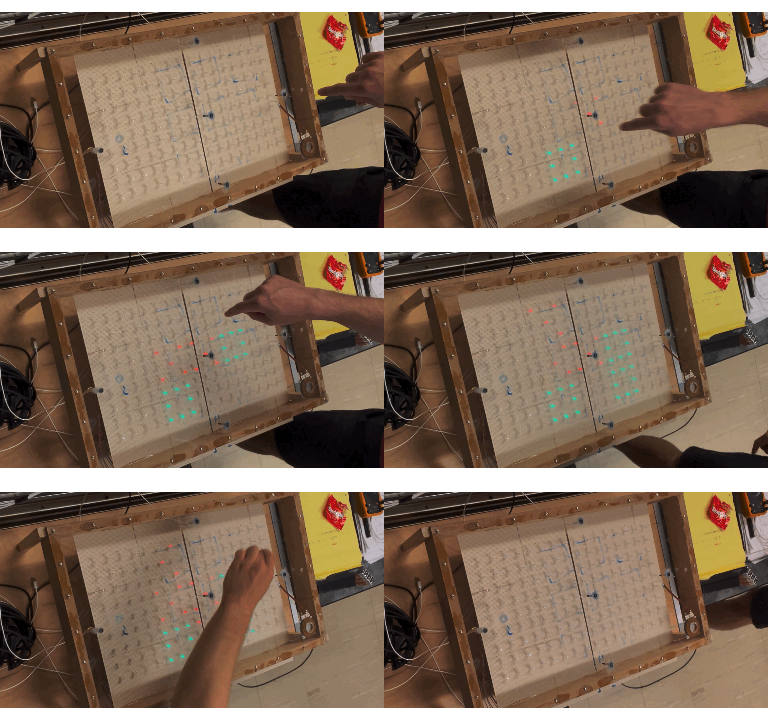
A conventional approach to acoustic-based touch sensing (and source localization in general) is to employ the relative time differences between signals recorded by an array of sensors to infer the location of the source (in this case, a bending wave induced by a user tapping on the surface). Master’s student Joe Bumpus, along with Ben Thompson and Tre DiPassio made this cool tic-tac-toe game to demonstrate the effectiveness of this method. (Note: I lost this game for demonstration purposes only!)
Time-Difference of Arrival (TDOA)
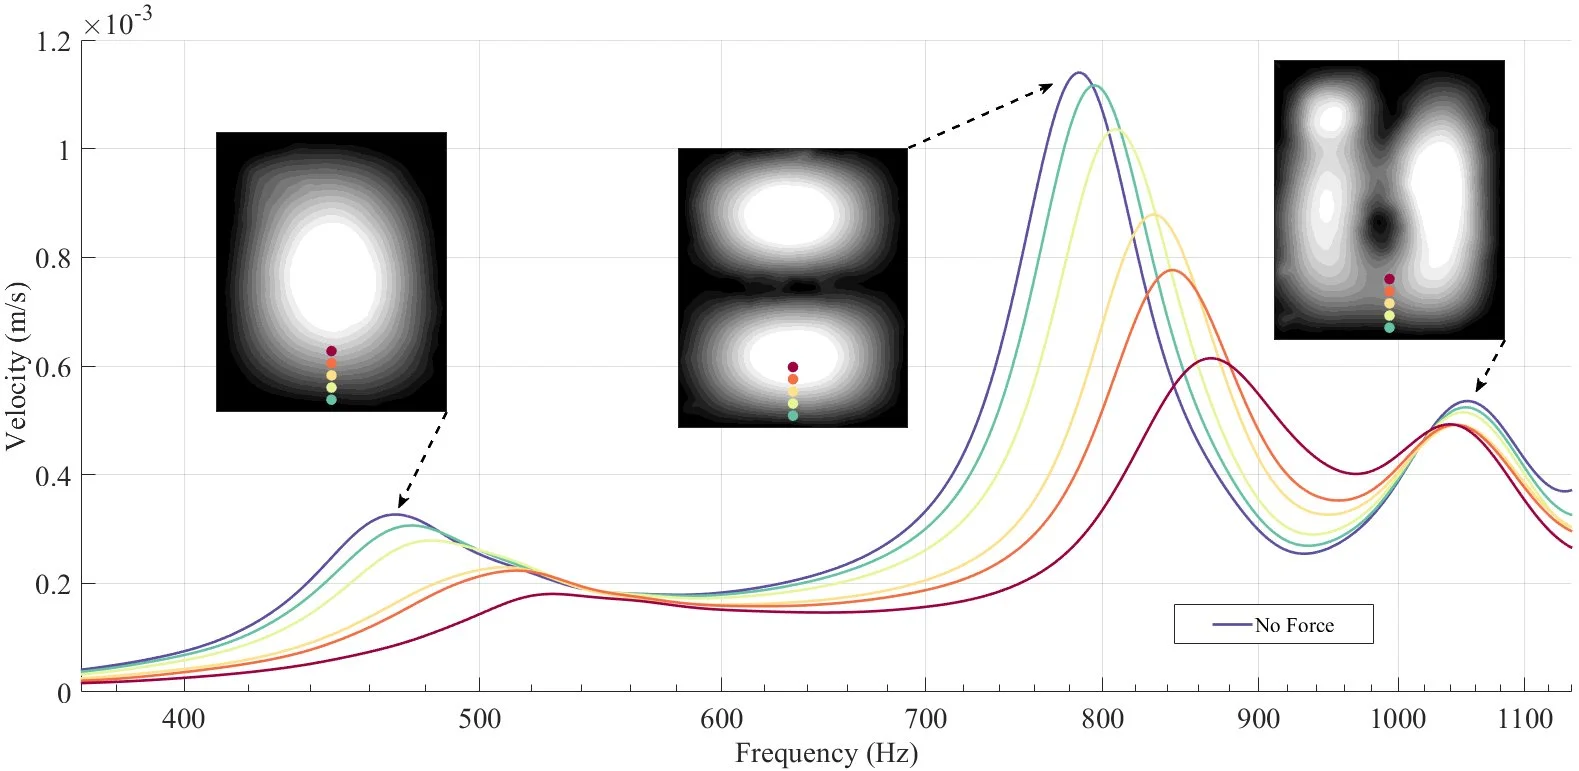
The bending modes of the surface convey a great deal of information about the source location. For example, different modes are excited with different amplitudes depending on the proximity of the touch interaction to the nodal lines of each mode as shown below. As the touch point approaches an antinode of a particular mode, the amplitude of that mode decreases, and the resonant frequency of that mode increases. If one can accurately measure the relative excitations and resonant frequencies of each resonant mode, one could infer the touch interaction that produced the vibration response. This would reduce the number of sensors required compared to TDOA methods.
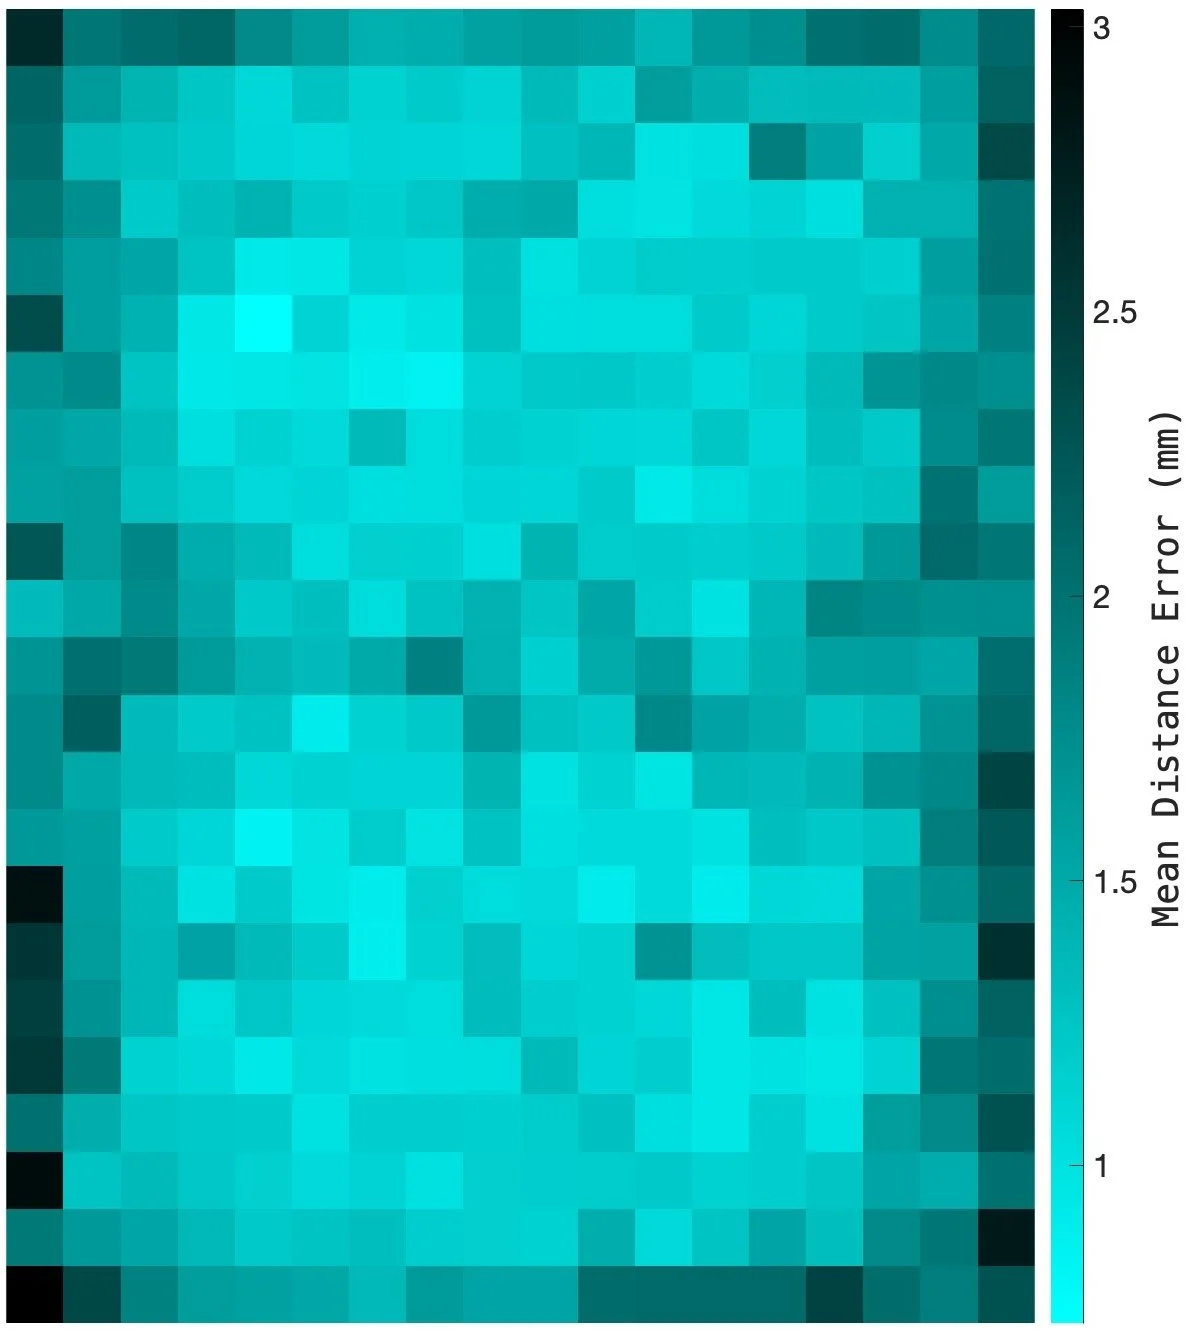
An active acoustic sensing (AAS) system consists of a panel with an affixed force exciter and vibration sensor to monitor the panel vibrations (see figure below). An automated system was used to manipulate a stylus to apply a light force to the panel at an array of known locations and the vibrational response of the panel was recorded by the affixed sensor. We employed a rectangular grid of 414 points with 10 mm spacing on a 2 mm thick acrylic panel of dimensions 18 cm by 23 cm. Features of the recordings were employed as training data for a deep neural network. The results demonstrate the viability of the AAS interface, and they show the relative performance of the system as a function of the selected features. The demonstration platform achieved a classification accuracy of 100% and a mean distance error of 0.20mm for regression. The best-performing feature sets were those that contained sufficient spectral resolution to discriminate subtle changes in the center frequencies and amplitudes of the panel’s modal resonances in response to small changes in touch location. The mean distance error for each touch point is also shown below using a convolutional neural network trained with a feature set comprising the complex discrete Fourier transform of the received signal. Notice that the sensor accuracy is, in general, worse when the touch point is near the edge of the surface where each mode has a nodal line.


